Estimating Whitetail Deer Score
August 28th, 2016 by BTC Editor
With the right camera and settings, photos captured can help immensely to accurately gauge a buck’s net score well before it hits the ground.
Hunting stores like Cabela’s have a wide range of trail cameras and filtering through pictures is quickly becoming a favorite past time of hunters. Like Christmas morning, each memory card filled with thousands of pictures is waiting to be opened and scanned. Every hunter will have a different level of “acceptable” target deer to hunt. For rookie hunters, anything that moves will usually suffice. Bow hunters might be interested in the Pope and Young minimum qualifying score as a target buck for the season. For others, it may be that elusive net score of 150 inches(“). And for the seasoned trophy hunters it’s likely to be upwards of 170” (the Boone and Crockett all time net typical minimum). Either way, it depends on what hunting stage the individual is in, where their hunting territory is and perhaps how much time they can afford to dedicate towards hunting season. No matter who you are, where you hunt or what your goals are, Boone and Crockett and Pope and Young conversation clubs established a consistent method of measuring deer antlers many years ago.
Previous to the 1990’s, trail cameras were non-existent. Now a days, it is hard to find a hunter without one. Trail cameras scout 24 hours a day, 7 days a week providing great information regarding:
- herd population
- herd age classes
- frequency of movement
- buck to doe ratio
- target bucks
- largest antlers
- worst genetics
Scoring a deer is the act of adding up all the qualifying inches the buck has. Scoring a live buck is difficult at best as they usually do not stand motionless for long or in the right position to properly gauge their score. This is where trail cameras can really help out, especially models with burst mode that take many pictures in rapid succession. A whitetail deer’s net typical score is composed of 5 components from the antler rack they possess:
- Length
- Height
- Thickness (mass)
- Spread
- Length of abnormal points
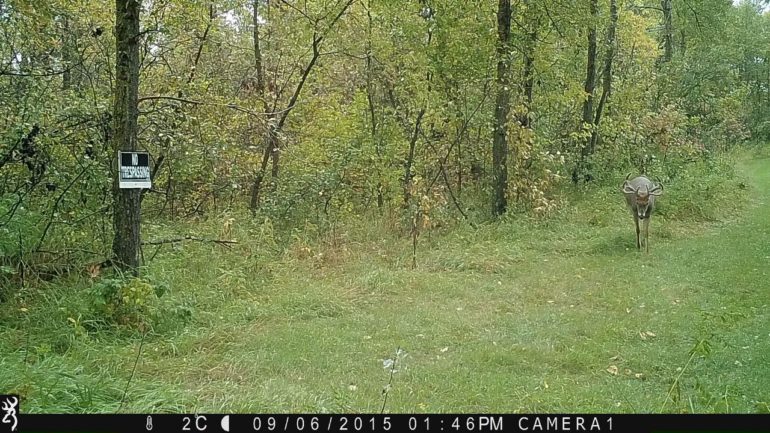
Length is measured as the total distance from where the antler start on the head to the tip, referred to as the main beam. If the length of the right main beam is shorter than the left, or vice versa, estimate the shortest. Antler symmetry is a factor, so an official score sheet will add the actual length of both sides and subtract the difference. Therefore, starting with the shorter main beam eliminates the step of adding and subtracting the inches that are not present on both main beams. To get a good estimate of length you need a picture of the buck from the front (looking at the camera) or top (facing the camera head on, but sniffing the ground). This orientation clearly outlines the main beam, how far it goes out towards/past the ears and will also help identify the shorter one (if any). A helpful second picture is a side profile of the deer’s head on alert (head up). This gives great indication of how far past the nose the main beam goes. The distance from the eyes to the tip of the nose on a mature buck in Alberta is 7”. Visit some mounted deer from your local hunting area and take measurements of this same distance and use it as a reference point. At the end you should have one number – the length of the shortest main beam.
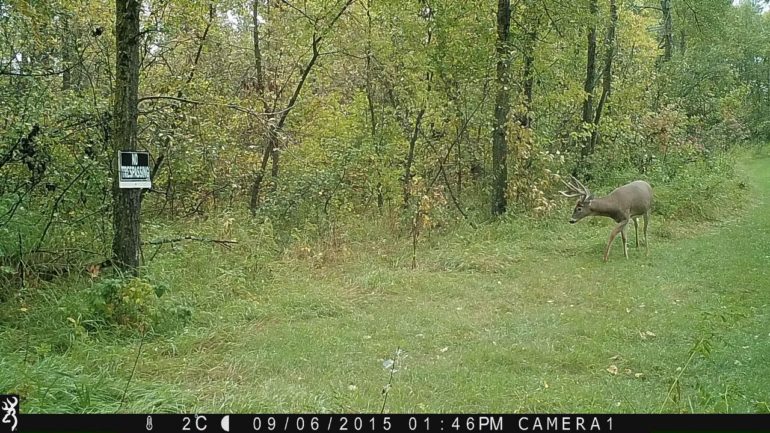
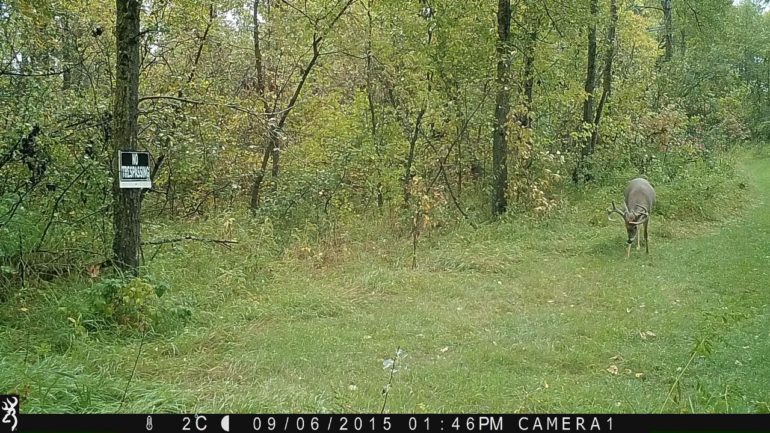
Using the outer distance between the eyes atop the skull as a gauge (6”), I estimated each main beam to extend outwardly 7.5” and then turn back inward 6.5”. Photo also give a clear view of the spread estimated at 19” (6.5 + 6 + 6.5) using the same gauge. Excellent photo to show the difference in the first tine set (G1’s) and to confirm this buck is a 4×4. I estimated the shortest G1 tine at 4”, again with the same gauge.
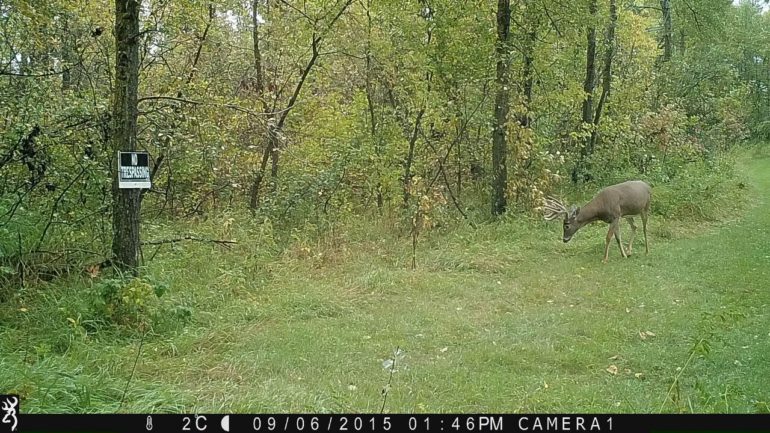
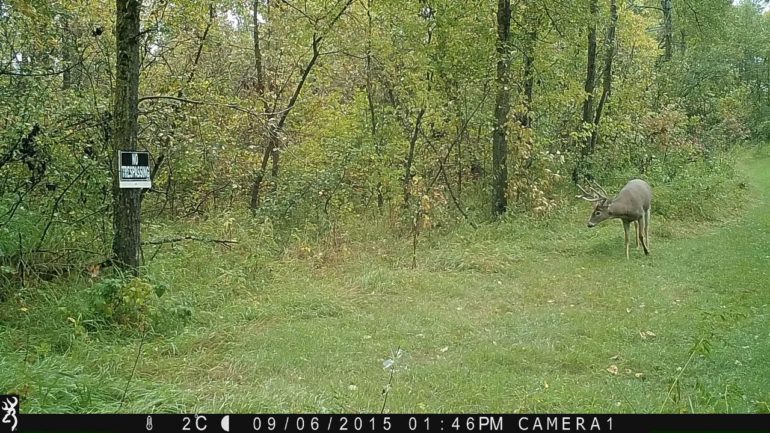
Using the distance from the eye to the snout tip as a gauge (7”), I estimated the middle part of the main beam to be 8”. I also used this picture (and same gauge) to estimate the second tine (G2) at 9”and the third tine (G3) at 7”. Estimated total tine height is 20.5” (9” + 7.5” + 4”). The main beams look very symmetrical but I estimated the right one at 22” (7.5” + 6.5” + 8”).
Net typical height is the total length of all tines (points) that come off the main beam, minus any differences between the sets. To begin, choose the first tine (starting from the head) sprouting from each main beam and estimate the length of the shortest one. Then use the same process on the next set of tines, until you are done. If one main beam has more tines than the other, ignore the extra tines. Only measure the typical tines, meaning where you’d expect the buck to have a tine coming off the main beam. You will need as many pictures as possible with the buck looking in all directions with his head held high. Use a reference like the distance from the eye to the tip of the nose to gauge the length of each tine. In the end you should have one number created by adding the estimated length of the shortest tine in each set. For example, if it was a 5×4 typical buck, you would have: (Shortest G1(brow) tine) + (Shortest G2 tine) + (Shortest G3 tine) + 0. Note: The tip of each main beam is not a tine and was already accounted for when estimating the main beam length. Official scoresheets have an excellent visual representation of the tines and their common names (G#).

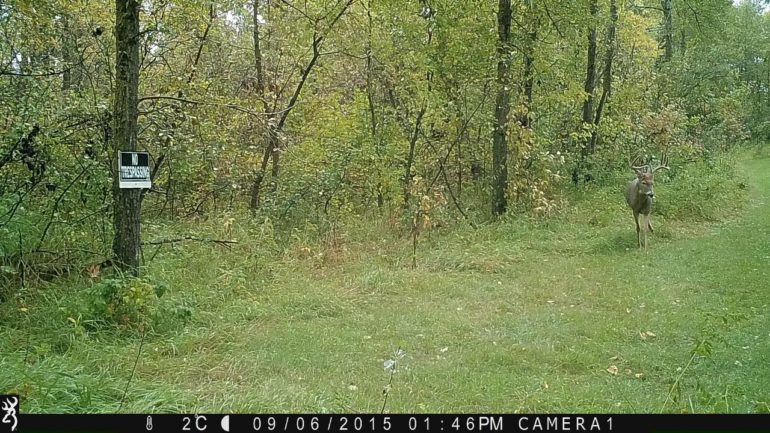
Photo gives a good indication of how many tines are on the antlers. In this case, an even three per side.
Mass (or thickness) of each antler is measured before each tine sprouts until you reach four measurements. Add those four number together for total mass. Again, use the antler that looks to be the smallest. More often than not I don’t bother with estimating this measurement and just use 18” on mature deer as a baseline. If the deer antlers look really thick, I will add up to 3” and vice versa for skinny antlers. Be cautious of bucks that move during photo capture causing them to appear ‘heavier’ (more mass) than they actually are. Browning trail cameras shoot the fastest shutter speed (even at night), minimizing motion blur and provided crisp photos to estimate mass. I have used both the snout and eye socket as a reference to diameter of the main beam because they both measure around 1.5 – 2”, but like I said, I usually just go with 18” as a conservative estimate.

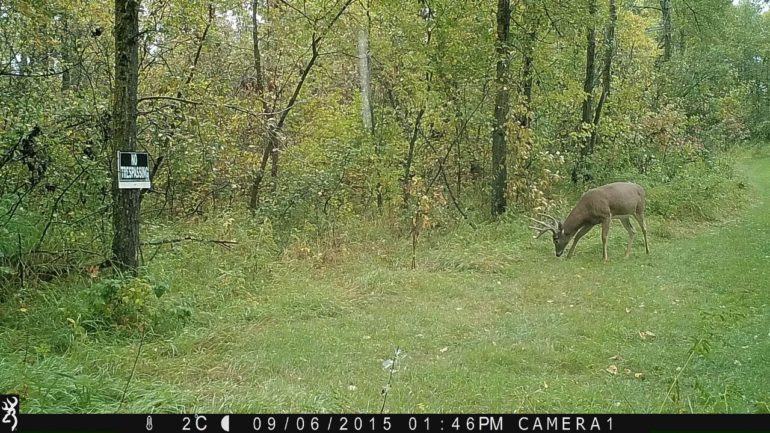
Unabstracted view of main beam thickness against grass, however this deer is in velvet (which counts). Compare it to the eyeball and snout.
Excellent photo to show symmetry because tine sets. This deer appears to have the same tine length on both the right and left antler.
Spread is the width between the left and right antler. Spread is measured by finding the longest distance between the inside of the right and left main beam. Unlike length, mass and height, spread is only counted once, not twice (for each antler side), therefore it contributes the least towards final score. A really wide 4×4 buck will be most impressive at first glance, but a narrower 5×5 buck should have a better score because it’s far easier to have 8 additional inches by having a forth 4” tine on each side as opposed to 8” between the right and left antler. A picture showing the ears and the buck looking at the camera is great to estimate spread. I have also used the skull as a good gauge to estimate spread.
Once you have estimated length, height, mass and spread, the final number required is the total length of all abnormal points. Any picture you have will help find these hidden deductions. Estimate the length of each one and tally them up to one number for both the right and left antler. If you have more than 15” of abnormal points, it qualifies for non-typical scoring instead of typical scoring.
For your final estimated net score do the following:
- Length + Height + Mass
- Double it
- Add Spread
- Subtract length of abnormal points (if less than 15 otherwise add)
The burst mode on this Browning trail camera took 8 pictures of this buck in rapid succession, providing various camera angles to accurately estimate the buck net typical score at 140”. ([22(length) + 20.5(height) + 18(mass)] x 2 + 19(spread) – 0(non-typical deductions)). I never did shoot this buck, so I’ll never know fore sure though.
An official score sheet is much more precise when it comes to deductions but since estimating the shorter and smaller side of the antlers eliminates those differences (from non-symmetry) immediately.
Remember, score is just a number, it does not consider effort, method of hunting, determination or atmosphere which all contribute to making a deer hunt memorable. Trail cameras are an excellent tool for estimating buck scores before a hunter decides to target that particular deer. I know I still enjoy “if it’s brown it’s down” hunts but I have enjoyed holding out for specific bucks captured on trail cameras that I know will qualify for Pope and Young records book based on the estimating process described above.
By Gord Nuttall
Gord Nuttall is an enthusiastic outdoorsmen and award-winning freelance writer that spends countless hours sorting through Browning trail camera pictures of western big game animals to pursue. Follow all his adventures at www.facebook.com/prostaffgordn